Vizzies I have loved

Matt Carroll, the Boston Globe’s data guru,  gave one of my classes a tutorial on Google Fusion last week. It was pretty awesome.

Carroll called data visualization an “exploding field” with a shortage of qualified  journalists. (Hear that, student journos? If you want a job you should learn a bit about data or at least spreadsheets.) I had hoped to post a vizzy of my own, but I’ve been bogged down in other projects these last few days. Instead, here’s a roundup of some impressive data visualizations I’ve seen lately:

Drone warfare graphic from The Guardian's website.
In this interactive graphic, The Guardian breaks down drone strikes in Pakistan since 2004. Photo/guardian.co.uk

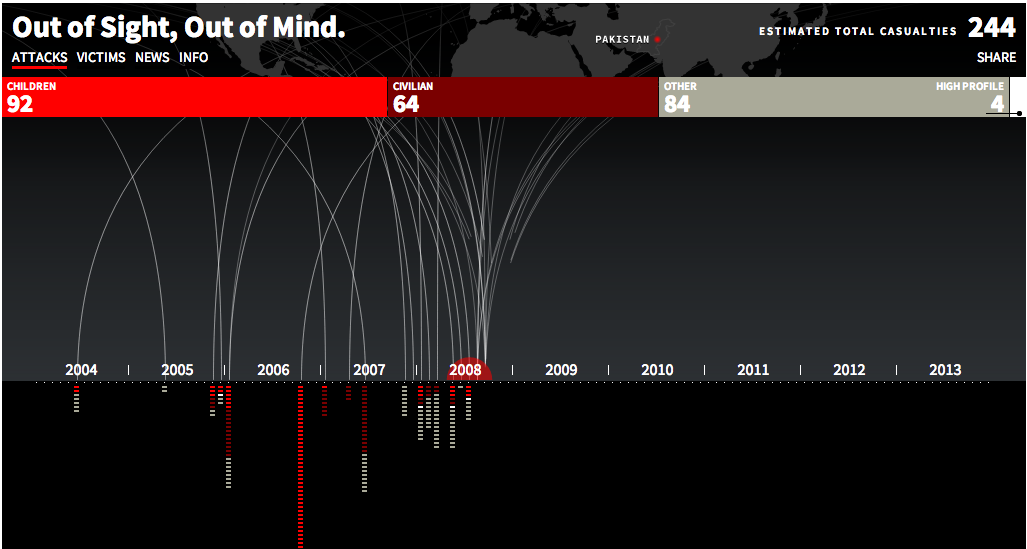
The Guardian’s Datablog is always amazing, but this animated, interactive look at drone warfare in Pakistan is in a class by itself. The designers used data from the Bureau of Investigative Journalism to illustrate the demographics of the more than 3,000 people killed by American drone strikes in Pakistan since 2004. The information is complex, but the design remains simple. A quick look shows how strikes became more frequent — and more deadly — after President Obama took office in 2009. Closer inspection reveals details about each attack.

Like the drone project, this graphic from the Associated Press is structured around a timeline. It uses colored circles the cost in terms of money and life of wars throughout American history. The AP published it today to mark the 40th anniversary of the end of American involvement in the Vietnam War. It’s simple, timely and contextualizes historic events.

ProPublica is packed with vizzies, including a few sophisticated enough to be reporting tools in their own right. One of my current favorites is this graph of where members of Congress stand on gun regulation. It’s a calm, clear look at an emotional topic. At first, I found all the little pictures distracting, but I came to appreciate them after playing with the graphic for a few minutes.

Why I love Zotero and you should too

Source: Zotero
Source: Zotero.org

Career adjustments are almost always laced with stress, especially when they’re made within the context of modern journalism. So when I started grad school last fall, my list of worries was long: figuring out the T, finding enough freelance clients to pay the bills, taking tests and — when it’s all over — finding a job in journalism education.

The one thing I didn’t have to fret over, though, was remembering how to cite research papers. My brother-in-law’s partner is a philosophy professor, and he introduced me to a digital citation tool called Zotero.  It won’t, alas, keep track of which professors like the Oxford comma and which consider it an affront to the English language, but Zotero is a great way to organize the many books and journal articles I’m reading these days.

What sets Zotero apart from other citation managers are its social features, including one that allows users to create shared libraries. Here’s one I’m putting together about women, journalism and digital news.  You should be able to see a list of publications — it’s short now, but there are more titles to comes — add comments, and download documents. It’s also compatible with most RSS readers.

What other publications should I include?

Mind the Gap: A video about gender, journalism … and coffee

Talk to me.

I mean it. The issues addressed on this blog — gender roles, media stereotypes, the influence of technology on journalism– are big and complex. Making sense of them will require an open, diverse conversation. To get us started, I put together a  video that ponders one of the bigger questions on my mind lately: If most journalism students are female, why are women chronically underrepresented in newsrooms?

For more on the statistics referenced, read this post from earlier this year.

Thank you to the students who sat for interviews… and to the campus Dunks for handing over an extra plastic cup without any questions.