
For our final Summer Tech Camp, we’re tackling Chartbuilder — the simple tool that’s behind many of Quartz’s crisp, useful charts and graphs. As David Yanofsky writes, Chartbuilder has given “everyone in our worldwide newsroom 24-hour access to simple charts at graphics-desk quality. “
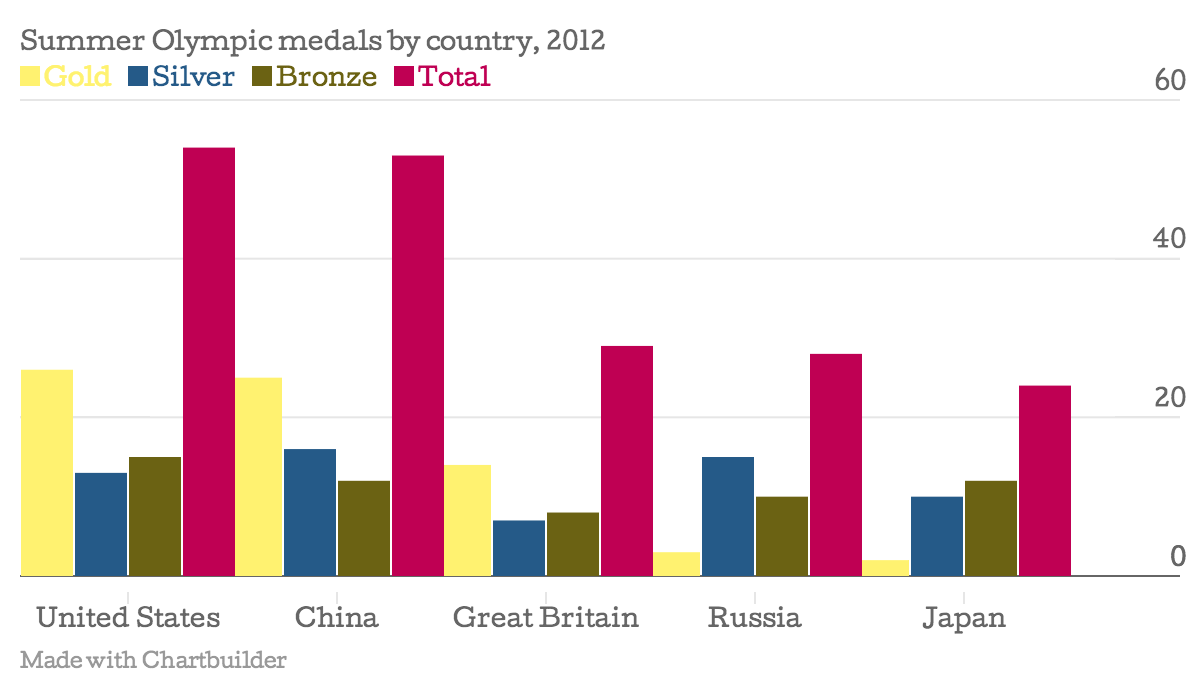
Now, that tool is available for even non-Quartz staffers to use. Here’s a chart I made showing the medal totals by country for the 2012 Summer Olympics:
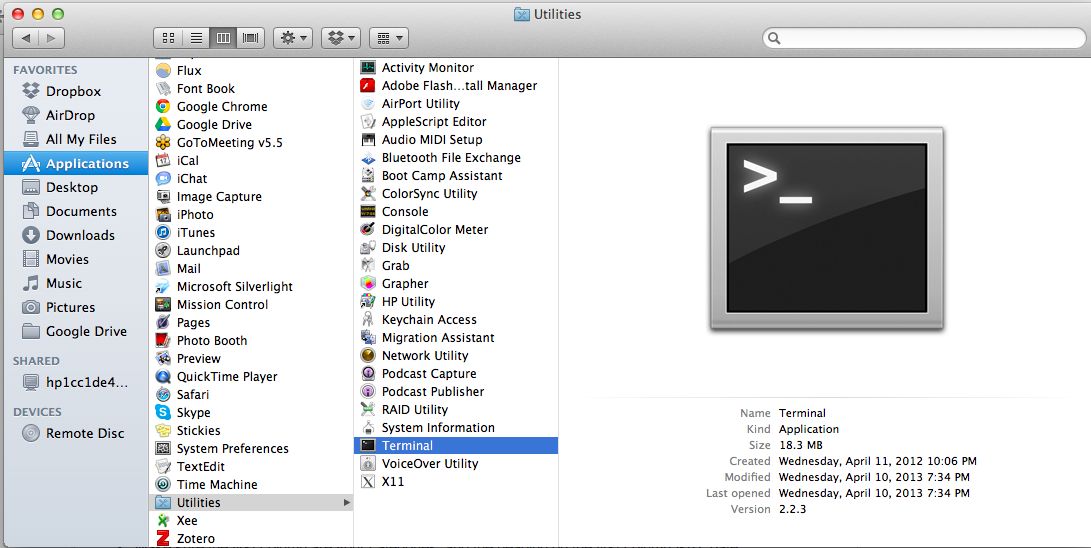
To launch Chartbuilder, you’ll need to enter a few command lines into your computer’s terminal. You’ll find the lines here under “getting started.” As for the terminal, here’s where to look on a Mac:
 PC users, you’re on your own. Just kidding. Try this set of instructions for opening the terminal in Windows 7.
Once you’re in the Chartbuilder interface, try playing around a bit with the pre-loaded data. Once you get a sense of how things work, try adding data of your own. Here are a few sample sets to get you started.
